Language
Login
Language Setting
X
English
日本語 [Japanese]
about this App
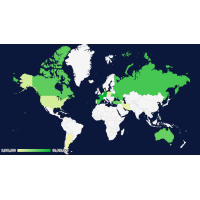
Visualization Map Generator For Statistical Data
useful
3
Loading...
var drawMarkersMap = function(rawData) { if(! rawData) { rawData =[]; } var data = google.visualization.arrayToDataTable(rawData); var options = {backgroundColor : '#0B173B', minValue: 0, colors: ['#F2F5A9', '#04B431']}; var chart = new google.visualization.GeoChart(document.getElementById('paintedMap')); chart.draw(data, options); } google.load('visualization', '1', {packages: ['geochart']}); google.setOnLoadCallback(drawMarkersMap); window.onload = function() { GenerateHeatmap.initFileList(); }; GenerateHeatmap = {}; GenerateHeatmap.fileName = ""; GenerateHeatmap.initFileList = function(){ var sb =[]; $.each(LinkData.getWorks(), function(workKey, workValue) { $.each(LinkData.getFiles(workValue), function(fileKey, fileValue) { sb[sb.length] = "<option value=\"" + fileValue + "\">"+ fileValue +"</option>"; }); }); $("#fileOptions").append(sb.join("")); $("#fileOptions").change(GenerateHeatmap.drawMap); $("#generate").click(generatePng); $("#generate").click(function(){ $(".downloadButton").css("display", ""); }); } GenerateHeatmap.drawMap = function(event){ var fileValue = event.currentTarget.value; if(fileValue == ""){ return ; } GenerateHeatmap.fileName = fileValue; var data = []; data[data.length] = ["Country", fileValue]; var workId = "rdf1s794i"; $.each(LinkData.getSubjects( workId, fileValue), function(subjKey, subjValue) { var countryCode =""; var measured =0; var propAry = LinkData.getProperties(workId, fileValue); for(var i = 0 ; i < propAry.length ; i++){ var propValue = propAry[i] if(propValue == "http://www.geonames.org/ontology#countryCode"){ countryCode = LinkData.getObjects(workId, fileValue, subjValue, propValue)[0]; } if(propValue == "http://linkdata.org/property/"+workId+"#value"){ measured = LinkData.getObjects(workId, fileValue, subjValue, propValue)[0]; } } data[data.length] = [countryCode, parseInt(measured, 10)]; // $("#debug").append(countryCode + " <-> "+measured + "<br>"); }); drawMarkersMap(data); } function generatePng(){ var svg = $("#paintedMap").children().children(); canvg('canvas', svg.html(), { ignoreMouse: true, ignoreAnimation: true } ); var c = document.getElementById('canvas'); var type = 'image/png'; var data = c.toDataURL(type); $('#png').attr('download', GenerateHeatmap.fileName + ".png"); $('#png').attr('href', data); }
*{ background: #FFF; } #generate { font-size:16px; font-family:Arial; font-weight:normal; -moz-border-radius:8px; -webkit-border-radius:8px; border-radius:8px; border:1px solid #dcdcdc; padding:4px 20px; text-decoration:none; background:-webkit-gradient( linear, left top, left bottom, color-stop(5%, #ededed), color-stop(100%, #dfdfdf) ); background:-moz-linear-gradient( center top, #ededed 5%, #dfdfdf 100% ); background:-ms-linear-gradient( top, #ededed 5%, #dfdfdf 100% ); filter:progid:DXImageTransform.Microsoft.gradient(startColorstr='#ededed', endColorstr='#dfdfdf'); background-color:#ededed; color:#777777; display:inline-block; text-shadow:1px 1px 0px #ffffff; -webkit-box-shadow:inset 1px 1px 0px 0px #ffffff; -moz-box-shadow:inset 1px 1px 0px 0px #ffffff; box-shadow:inset 1px 1px 0px 0px #ffffff; margin-top: 10px; } #generate:hover { background:-webkit-gradient( linear, left top, left bottom, color-stop(5%, #dfdfdf), color-stop(100%, #ededed) ); background:-moz-linear-gradient( center top, #dfdfdf 5%, #ededed 100% ); background:-ms-linear-gradient( top, #dfdfdf 5%, #ededed 100% ); filter:progid:DXImageTransform.Microsoft.gradient(startColorstr='#dfdfdf', endColorstr='#ededed'); background-color:#dfdfdf; } #generate:active { position:relative; top:1px; } .downloadButton { font-size:16px; font-family:Arial; font-weight:normal; -moz-border-radius:8px; -webkit-border-radius:8px; border-radius:8px; border:1px solid #74b807; padding:4px 20px; text-decoration:none; background:-webkit-gradient( linear, left top, left bottom, color-stop(5%, #89c403), color-stop(100%, #77a809) ); background:-moz-linear-gradient( center top, #89c403 5%, #77a809 100% ); background:-ms-linear-gradient( top, #89c403 5%, #77a809 100% ); filter:progid:DXImageTransform.Microsoft.gradient(startColorstr='#89c403', endColorstr='#77a809'); background-color:#89c403; color:#ffffff; display:inline-block; text-shadow:1px 1px 0px #528009; -webkit-box-shadow:inset 1px 1px 0px 0px #a4e271; -moz-box-shadow:inset 1px 1px 0px 0px #a4e271; box-shadow:inset 1px 1px 0px 0px #a4e271; margin-top: 10px; } .downloadButton:hover { background:-webkit-gradient( linear, left top, left bottom, color-stop(5%, #77a809), color-stop(100%, #89c403) ); background:-moz-linear-gradient( center top, #77a809 5%, #89c403 100% ); background:-ms-linear-gradient( top, #77a809 5%, #89c403 100% ); filter:progid:DXImageTransform.Microsoft.gradient(startColorstr='#77a809', endColorstr='#89c403'); background-color:#77a809; } .downloadButton:active { position:relative; top:1px; }
<div id="result"></div> <div id="fileList"> Input Data: <select id="fileOptions" > <option value="">Select a file</option> </select> <br> <button id="generate">Generate PNG file</button> <a id="png" href="" type="application/octet-stream" download="sample.png" class="downloadButton" style="display:none;">Dowload</a> </div> <div id="paintedMap" style="width: 900px; height: 500px;"> </div> <canvas id="canvas" width="1000px" height="600px" style="display:none;"></canvas> <div id="debug"></div>
Preview
Input Data
ReadMe
Snapshots
LinkData Work
Table Data
Production of crops top15 countries in 2010
Contributor:Sayoko Shimoyama
Update:Sep 18, 2018
4277 Downloads, 4 Applications
Top 15 countries of production of crops in 2010.
barley_top15_2010
corn_top15_2010
oats_top15_2010
peanut_2010
peanut_top15_2010
potato_top15_2010
rice_top15_2010
rye_top15_2010
soybean_top15_2010
sweet_potato_top15_2010
wheat_top15_2010
Add LinkData work(LinkData)
Link http://app.linkdata.org/run/app1s341i?tab=readme
<p></p><p>国別の統計データを世界地図上にマップするアプリです。</p><p>表示した画像をPNG形式のファイルでダウンロードすることができます。</p><p><br></p><p>画像ダウンロードの手順:</p><p>1. "Input Data" のプルダウンメニューから表示したいデータを選択</p><p>2. "Generate PNG file" ボタンをクリック</p><p>3. "Download" ボタンをクリック</p><p></p>
jquery-1.7.1.min.js
http://www.google.com/jsapi
http://canvg.googlecode.com/svn/trunk/rgbcolor.js
http://canvg.googlecode.com/svn/trunk/canvg.js
Work
Add
Clear
insert work id or work name.